Opening: a quiet contrast between value and price
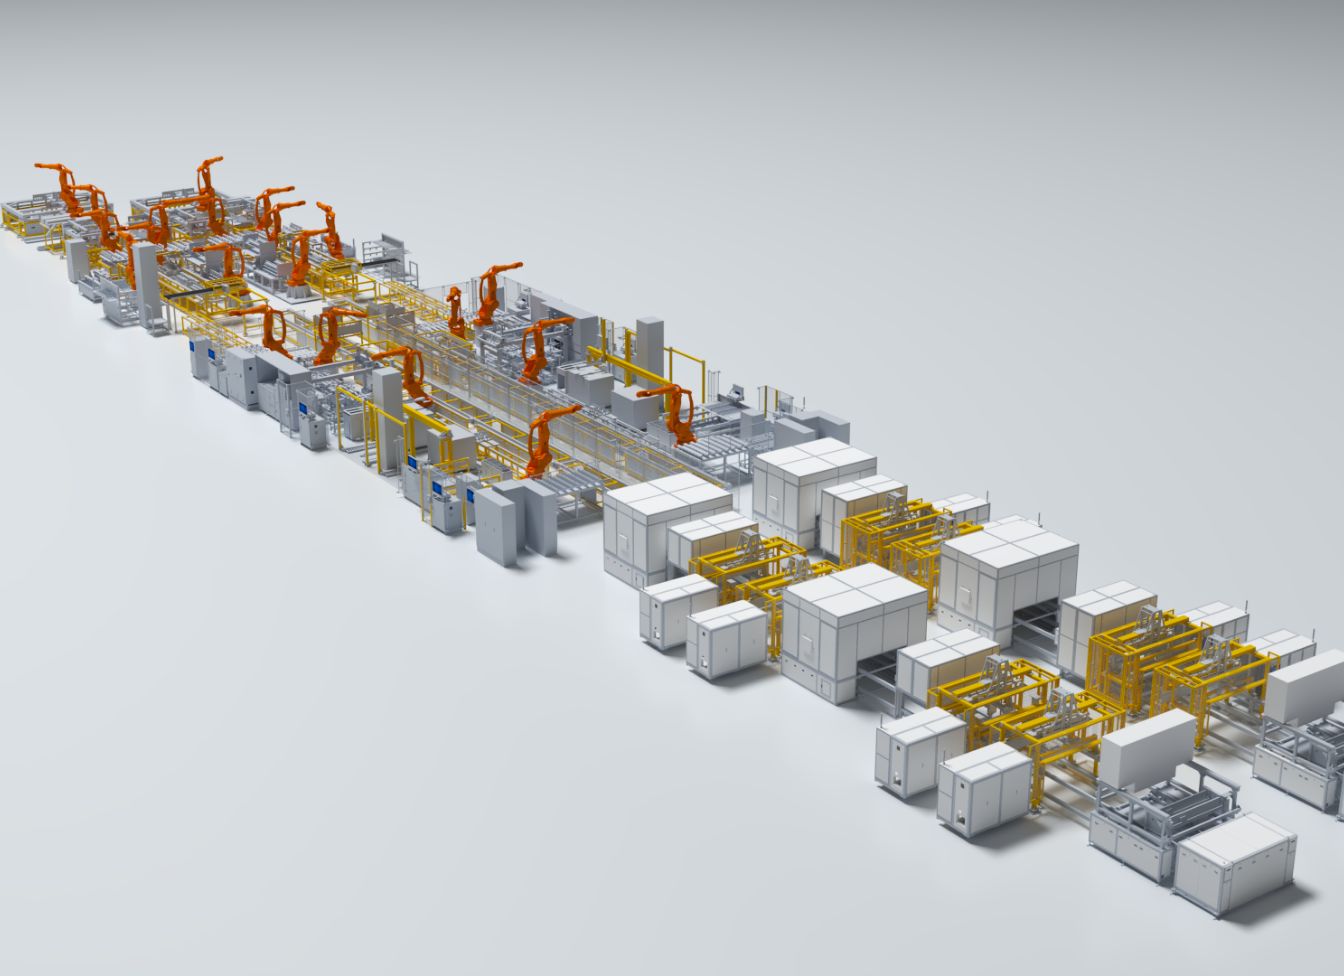
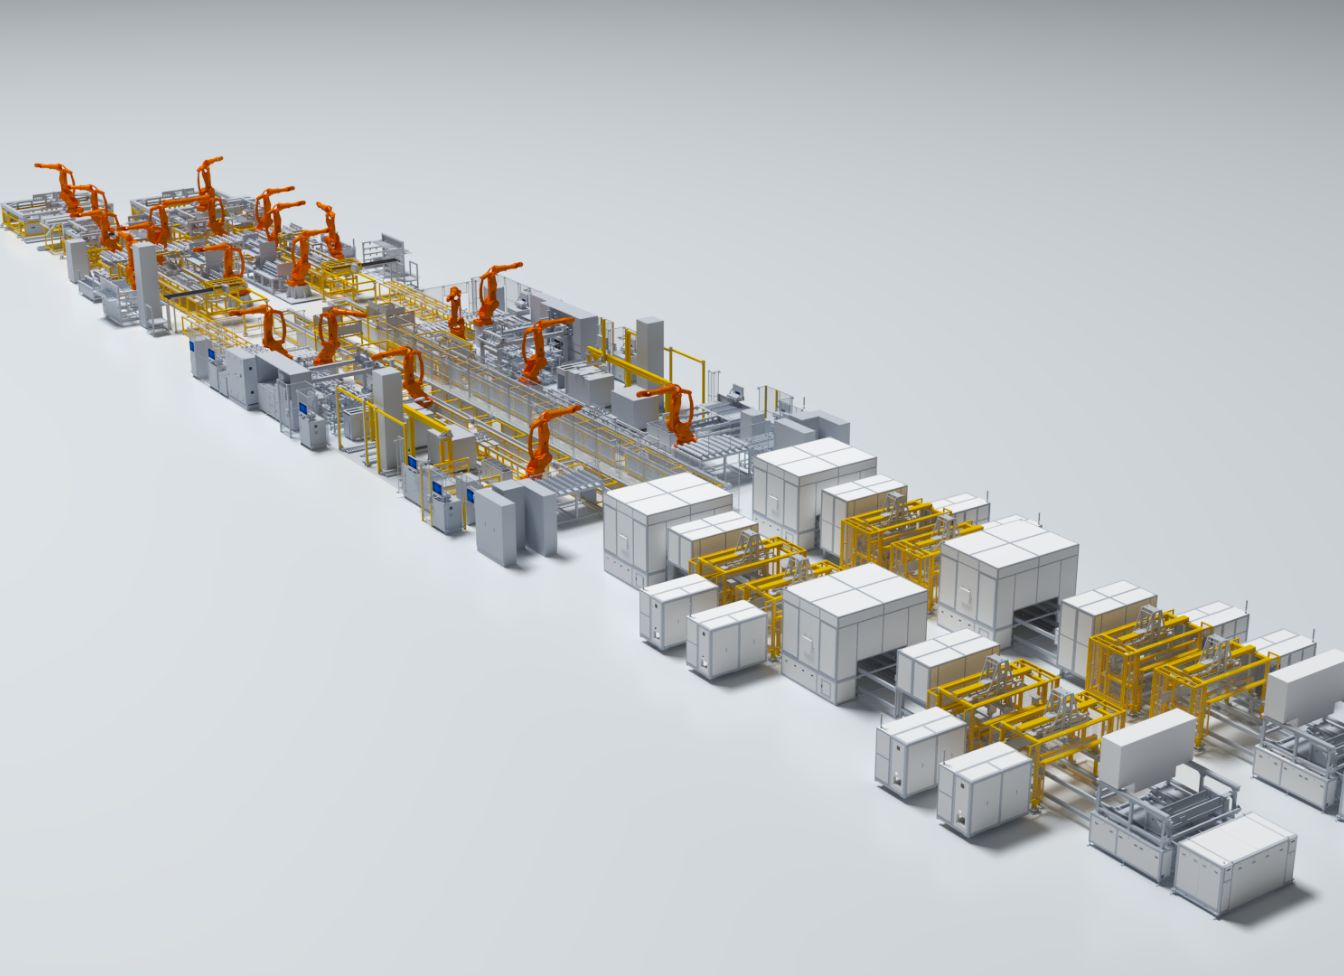
The way a production line breathes tells you more than spreadsheets ever will; compare that breath to the steady pulse of a blade battery assembly line and the point becomes plain—machines can be poetry or ledger entries. From a Comparative Insight stance, this piece lays out concrete comparisons so you can choose not with wishful thinking but with measured clarity, weighing long-term clinical reliability against upfront expense with a subtle, yet exacting eye.
What “lifecycle value” really measures
Lifecycle value is not a slogan. It is a set of measurable outcomes that matter to patients, regulators, and procurement teams:- Clinical integrity: fewer defects, consistent tolerances, predictable test-pass rates.- Throughput matched to demand: capacity without excessive idle time.- Compliance and traceability: automated data capture that eases audits.- Flexibility and upgradeability: ability to reconfigure for new devices without full replacement.- Time-to-market: how quickly an assembly path supports product launches.These are the benefits that produce downstream savings or revenue. Treat them as variables in an honest comparison rather than abstract virtues.

What “total cost” must include
Total cost is broader than purchase price. Count these items explicitly:- Capital expenditure (CAPEX): equipment, fixtures, and facility changes.- Integration and validation: software, protocols, IQ/OQ/PQ time.- Training and personnel transition costs.- Operating expenses (OPEX): energy, consumables, scheduled maintenance.- Downtime impact: lost production during failures or changeovers.- Obsolescence reserve: planned refresh cycles and spare parts stock.Add these annually and forecast at least five years. Put numbers beside each line and refuse vague assurances.
Comparative map: manual, hybrid, full automation
Lay three options side by side and score them on the metrics above. Brief guide:- Manual: low CAPEX, high variability, high labor cost, fast adaptability for small volumes.- Hybrid: moderate CAPEX, reduced variability where it matters, easier validation around automated stations.- Full automation: high CAPEX, lowest variability, highest throughput, greater validation burden and longer ramp-up.Choose hybrid when product variants are many and volumes moderate. Choose full automation when volume, regulatory burden, and defect-cost justify the investment. Quantify: estimate defect cost per unit and project how defect reduction alters breakeven months.
Common pitfalls that skew comparisons
Watch for these traps:- Ignoring validation time: long qualification phases push costs into year one and delay benefits.- Underestimating training and SME (subject-matter expert) needs: they carry continuous cost.- Counting only machine uptime, not quality impact: high speed with poor yield is false economy.- Overlooking supplier lock-in: narrow interfaces raise future retrofit costs.- Treating throughput as identical to capacity: planned maintenance windows and changeovers reduce effective output.Spot any proposal missing these items; it’s incomplete and will surprise you later.
Actionable checklist to run a side-by-side comparison
Use this sequence to avoid wishful comparisons:1) Define target KPIs (yield, takt time, first-pass yield, CLs).2) Build cost rows for 5 years with CAPEX amortized and OPEX annualized.3) Model scenarios: baseline demand, 20% growth, and a recall event.4) Calculate simple payback and a basic NPV with a conservative discount rate.5) Stress-test for a 10% drop in yield and a 20% increase in maintenance.6) Capture regulatory time: estimate IQ/OQ/PQ days and include consultant hours.7) Validate assumptions with a pilot run or factory acceptance test before signing contracts.Numbers change minds. Run them and keep the assumptions visible for every stakeholder.
Real-world anchor and transferable lessons
Shenzhen’s manufacturing clusters offer a clear lesson: teams that instrument test points and version control early reduce validation cycles later. A blade battery module production line built with early, modular test stations requires less rework than a rigid, monolithic cell. Study that pattern—modularity shortens validation and lowers long-term risk when product specs shift or regulators request design history files.
Final synthesis
Compare like a conservator: weigh the cost of every repair against the promise of steady, predictable outcomes. Measure not only what you pay now, but how each choice preserves patient safety, eases audits, and adapts to change. That careful balance—practical, precise, and slightly visionary—points toward partners who design with modular testing, clear validation paths, and long service horizons; partners such as FHS meld engineering rigor with practical deployment experience so that lifecycle value and total cost speak the same language.